Archive for the ‘Infrastructure’ Category

Teralytics Flow – AI Co-Pilot for public transport

We are pleased to present Teralytics Flow at the UITP Congress 2025 in Hamburg. Teralytics Flow is designed as a co-pilot for public transport planners, linking travel demand data with APC data and supporting the rapid testing of supply scenarios.

Linking APC with overall mobility

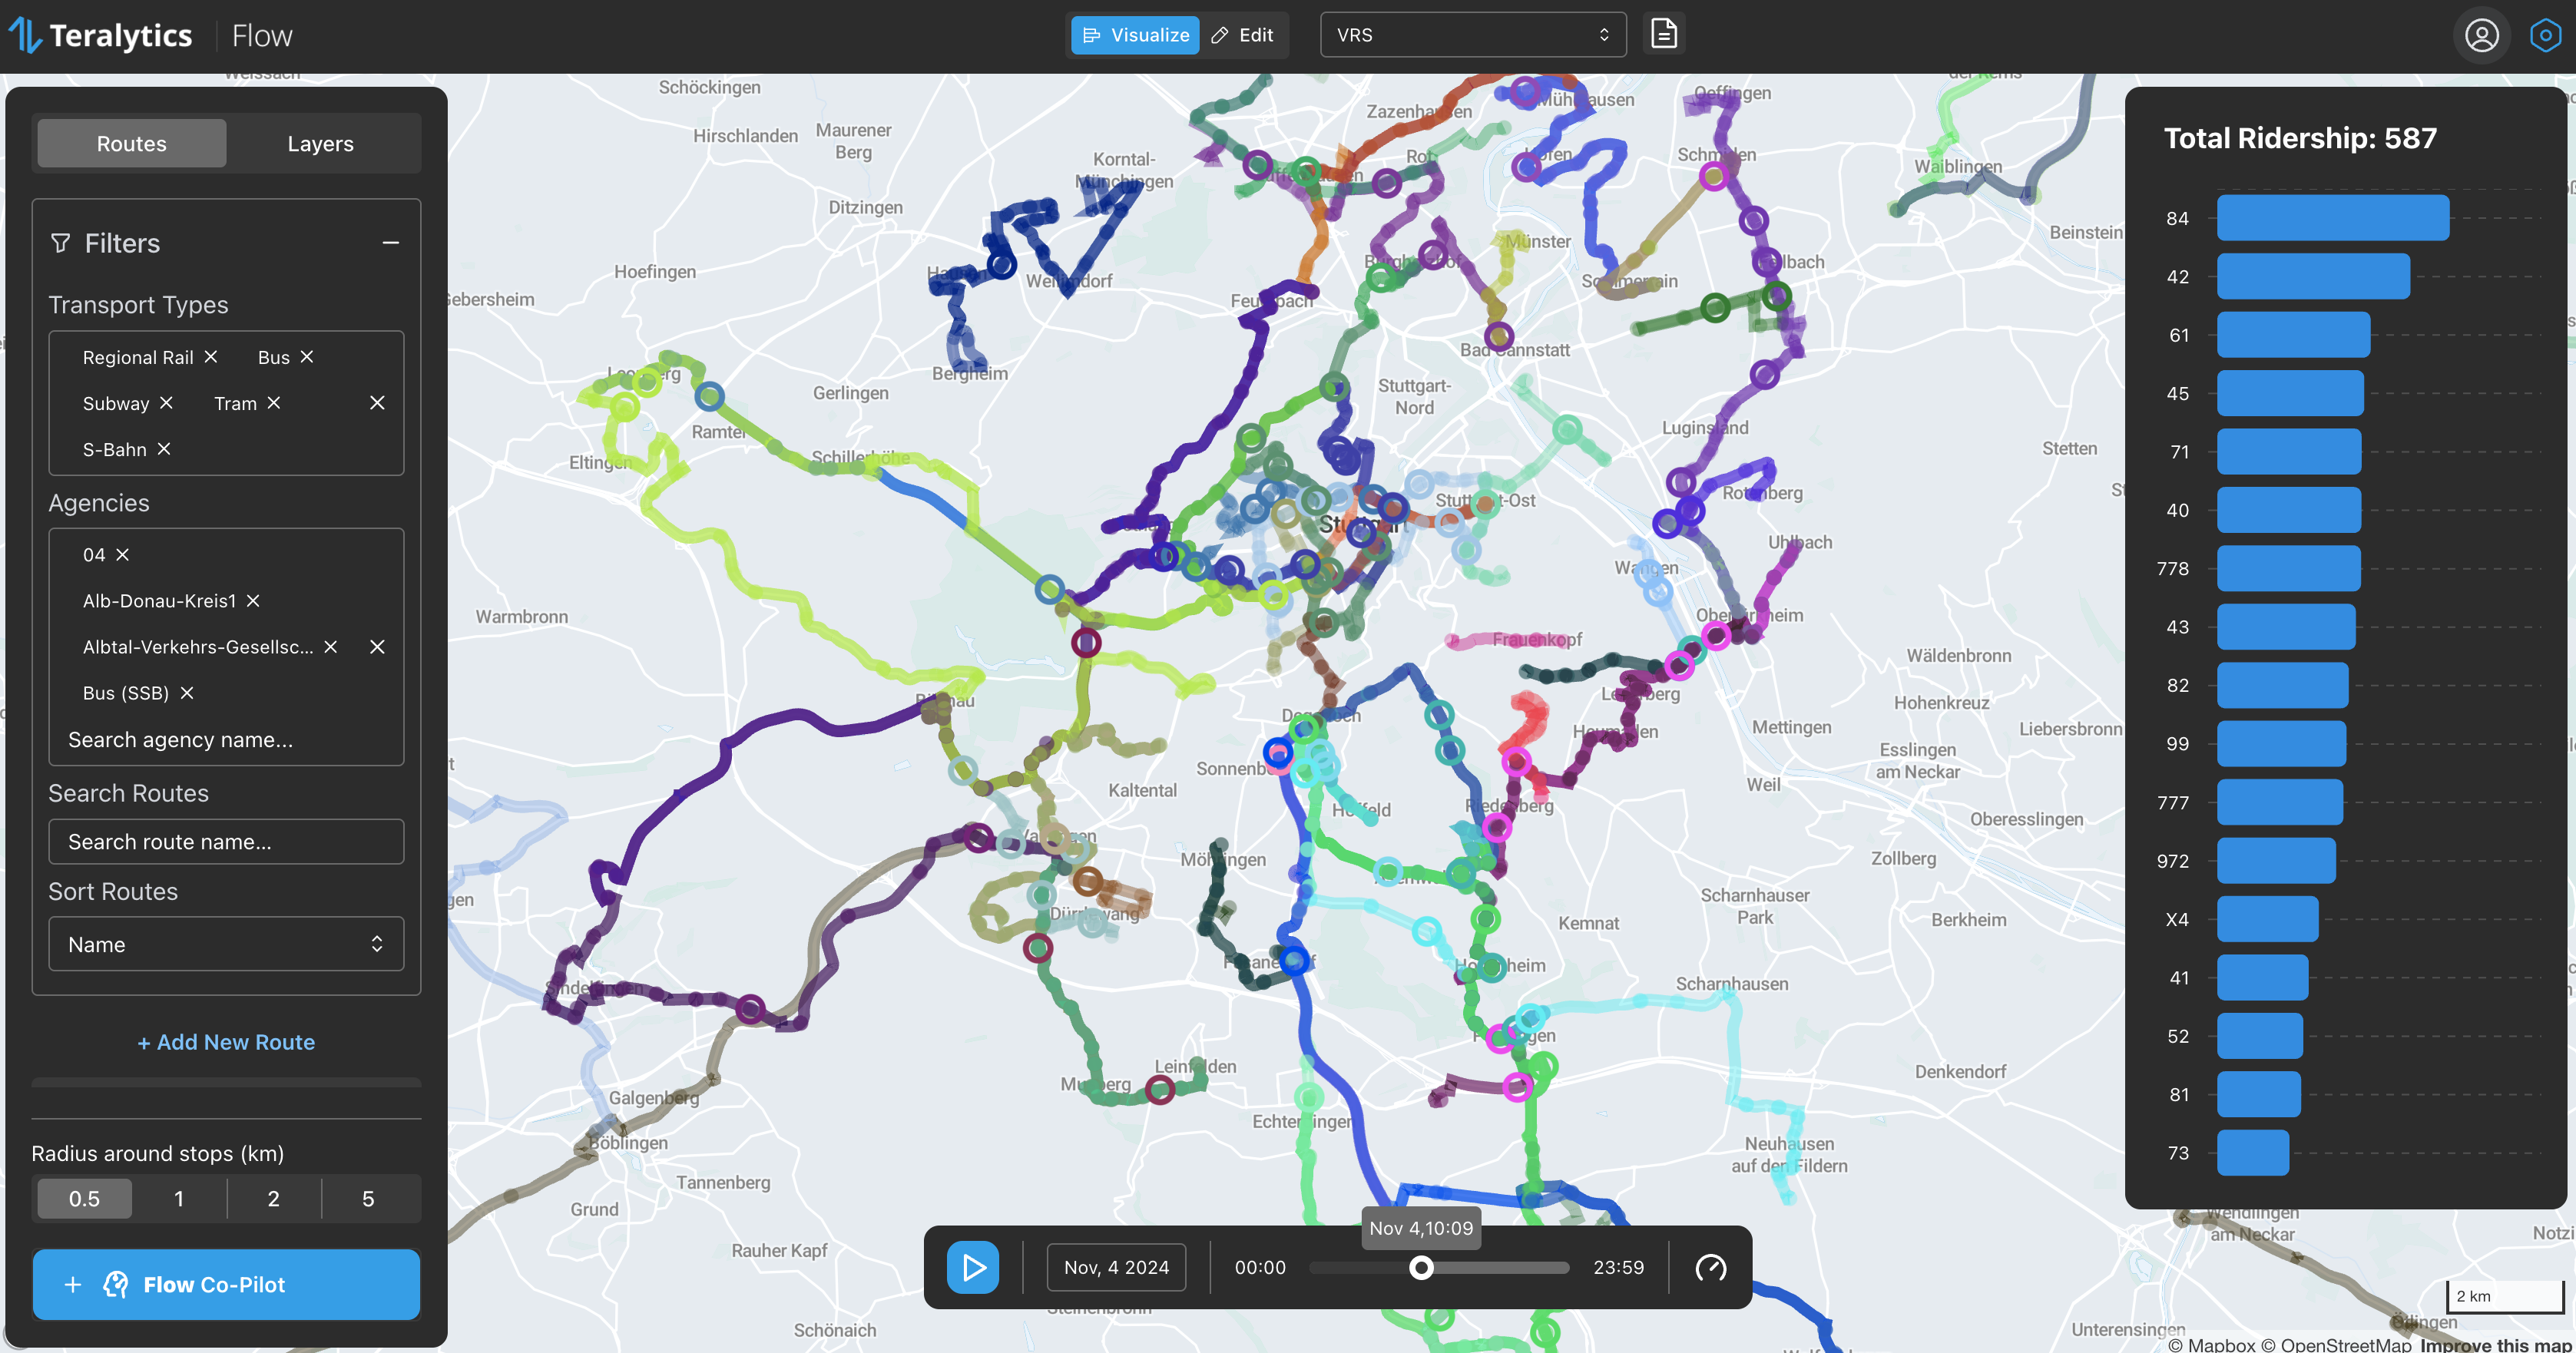
Display and analyze APC data

Teralytics Flow makes it easy to integrate APC data and display it visually on a map and in graphs. This allows you to quickly identify routes and journeys with high or low capacity utilization.

Continuously measure public transport market shares

By integrating total mobility (that can come from suppliers like Streetlight Data, Replica or from your existing travel demand model) in combination with APC data, the market shares for each line can be easily calculated and monitored. This means that Teralytics Flow can be used to assess the impact of changes in services, marketing and tickets.

Flow APC Visualization

Overlay with reference data

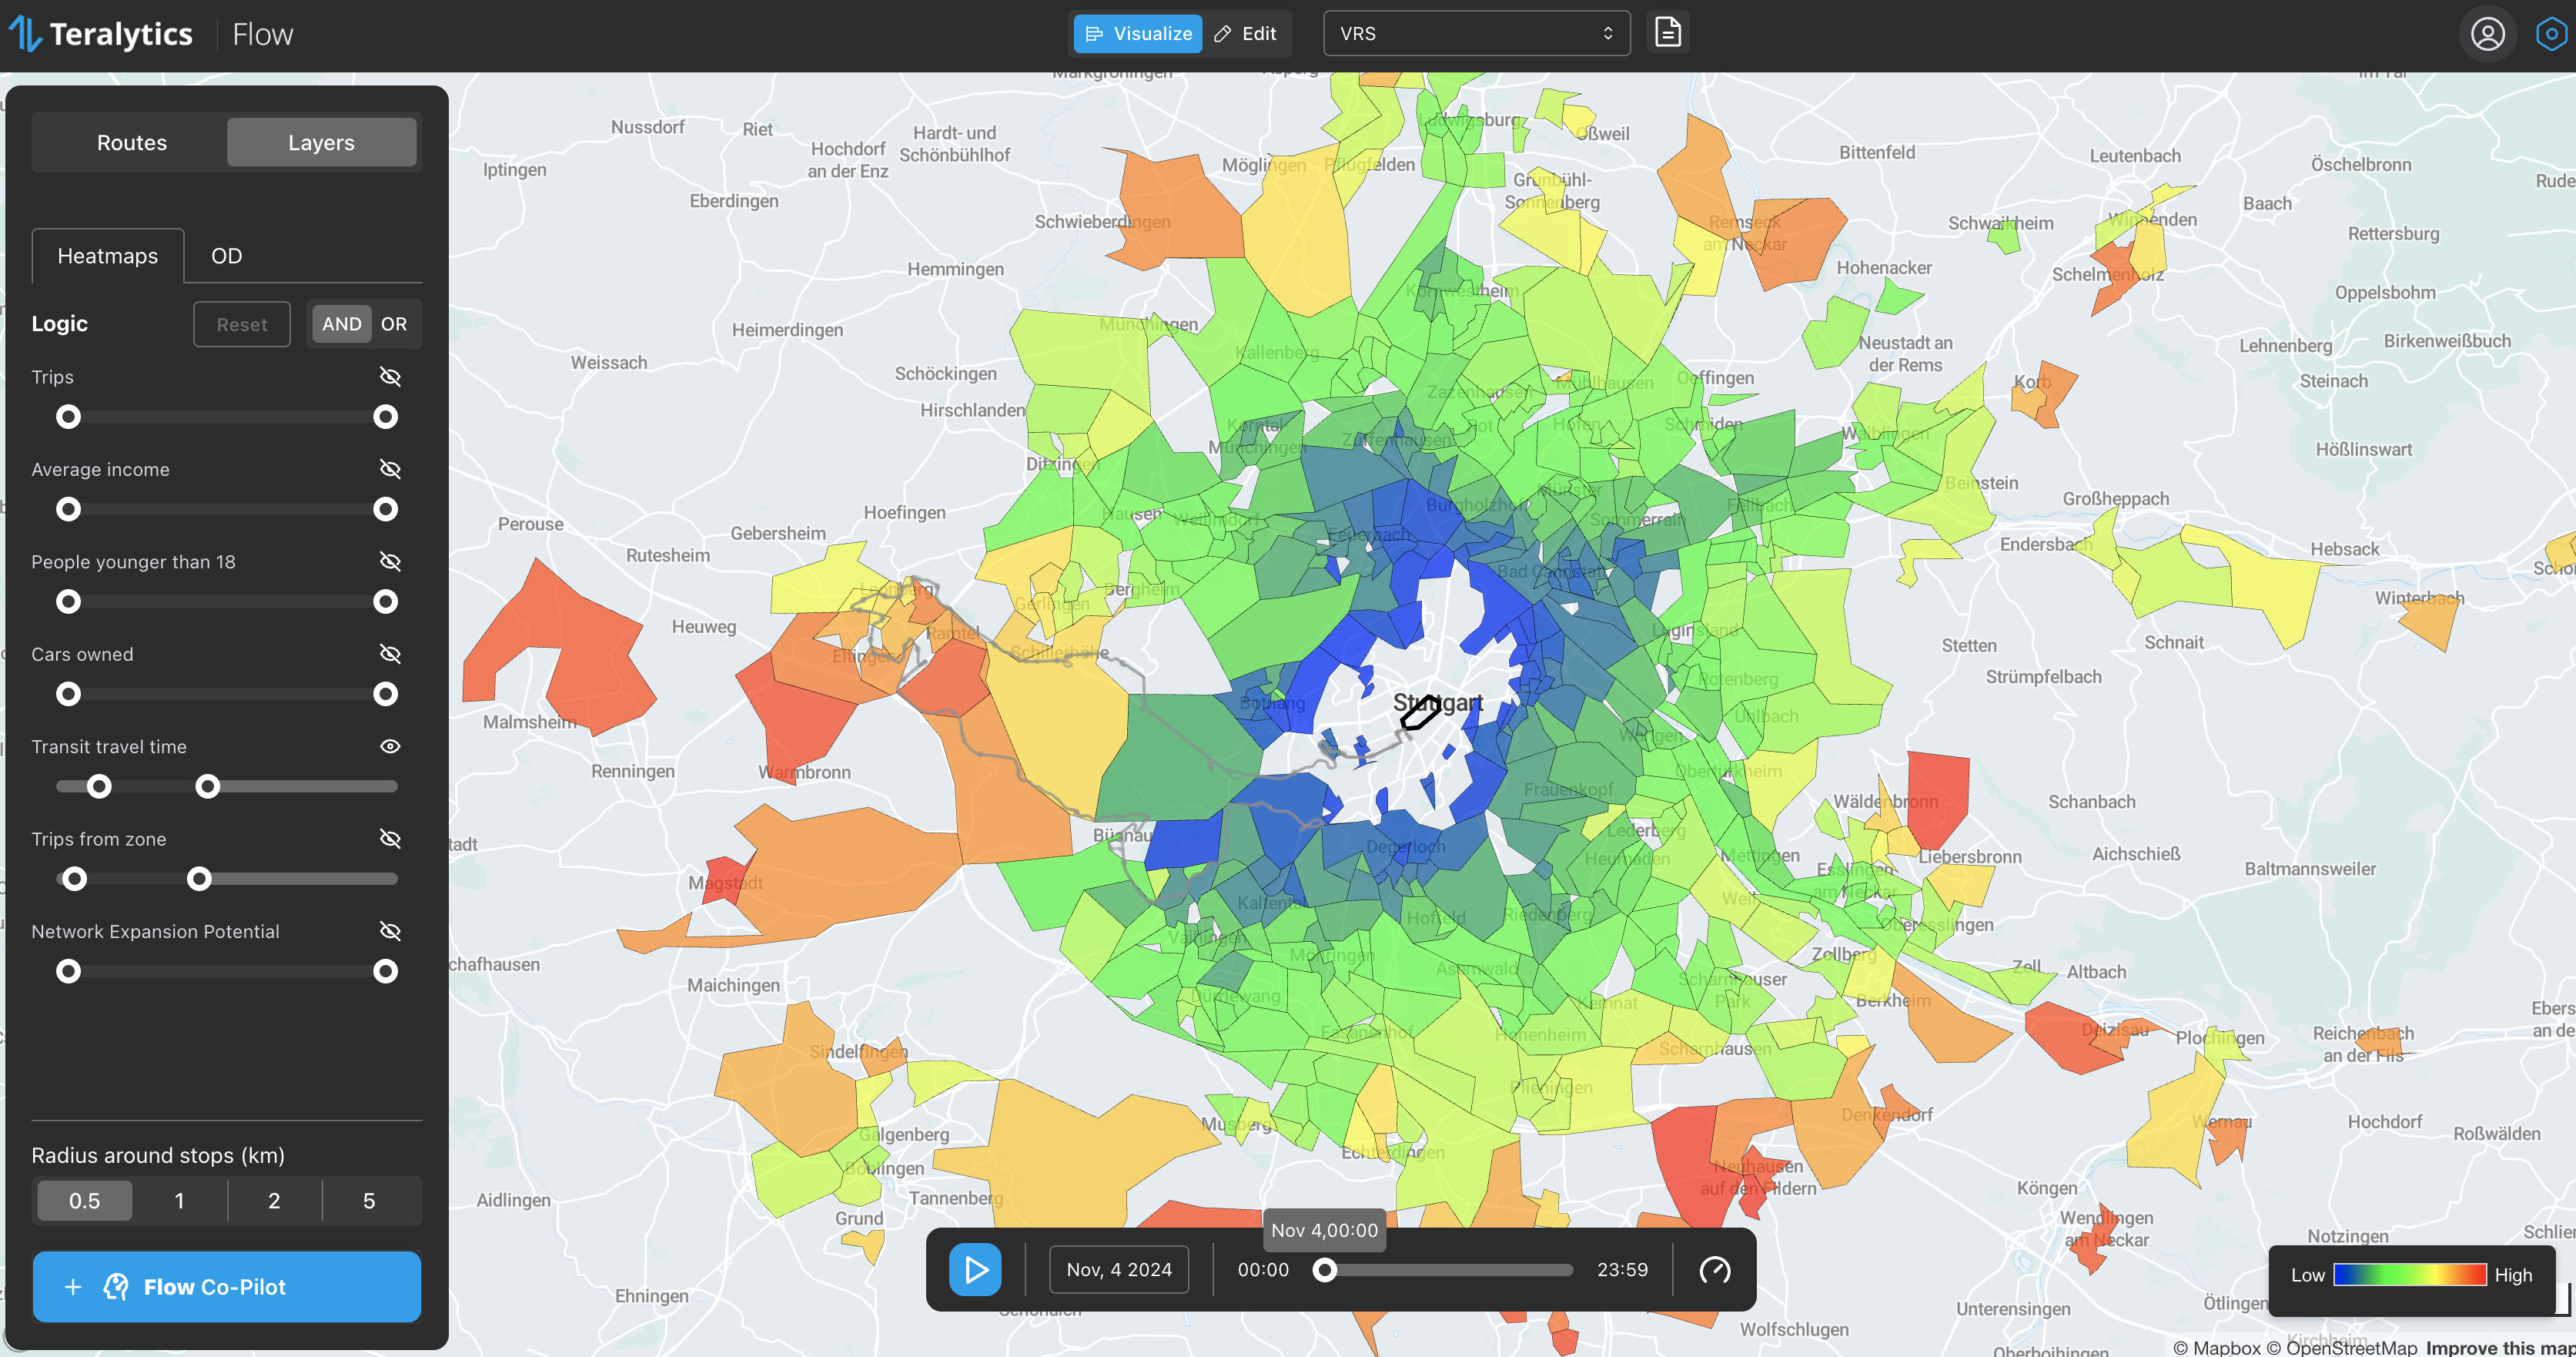
Demand, public transport travel times, income, age distribution

Teralytics Flow makes it easy to graphically integrate additional reference data that is essential for the planning process. This currently includes the total number of trips (from sources like Streetlight Data, Replica or your own travel demand model), income data, car ownership, age distribution and public transport travel times. These data levels can be freely combined and filtered. The image shows, for example, the combination of public transport travel times from a zone with the number of outbound trips from the zone. This makes it possible to identify areas with high travel demand that are not yet optimally connected to the public transport network.

Flow Reference Data

Easy travel time and market coverage scenarios

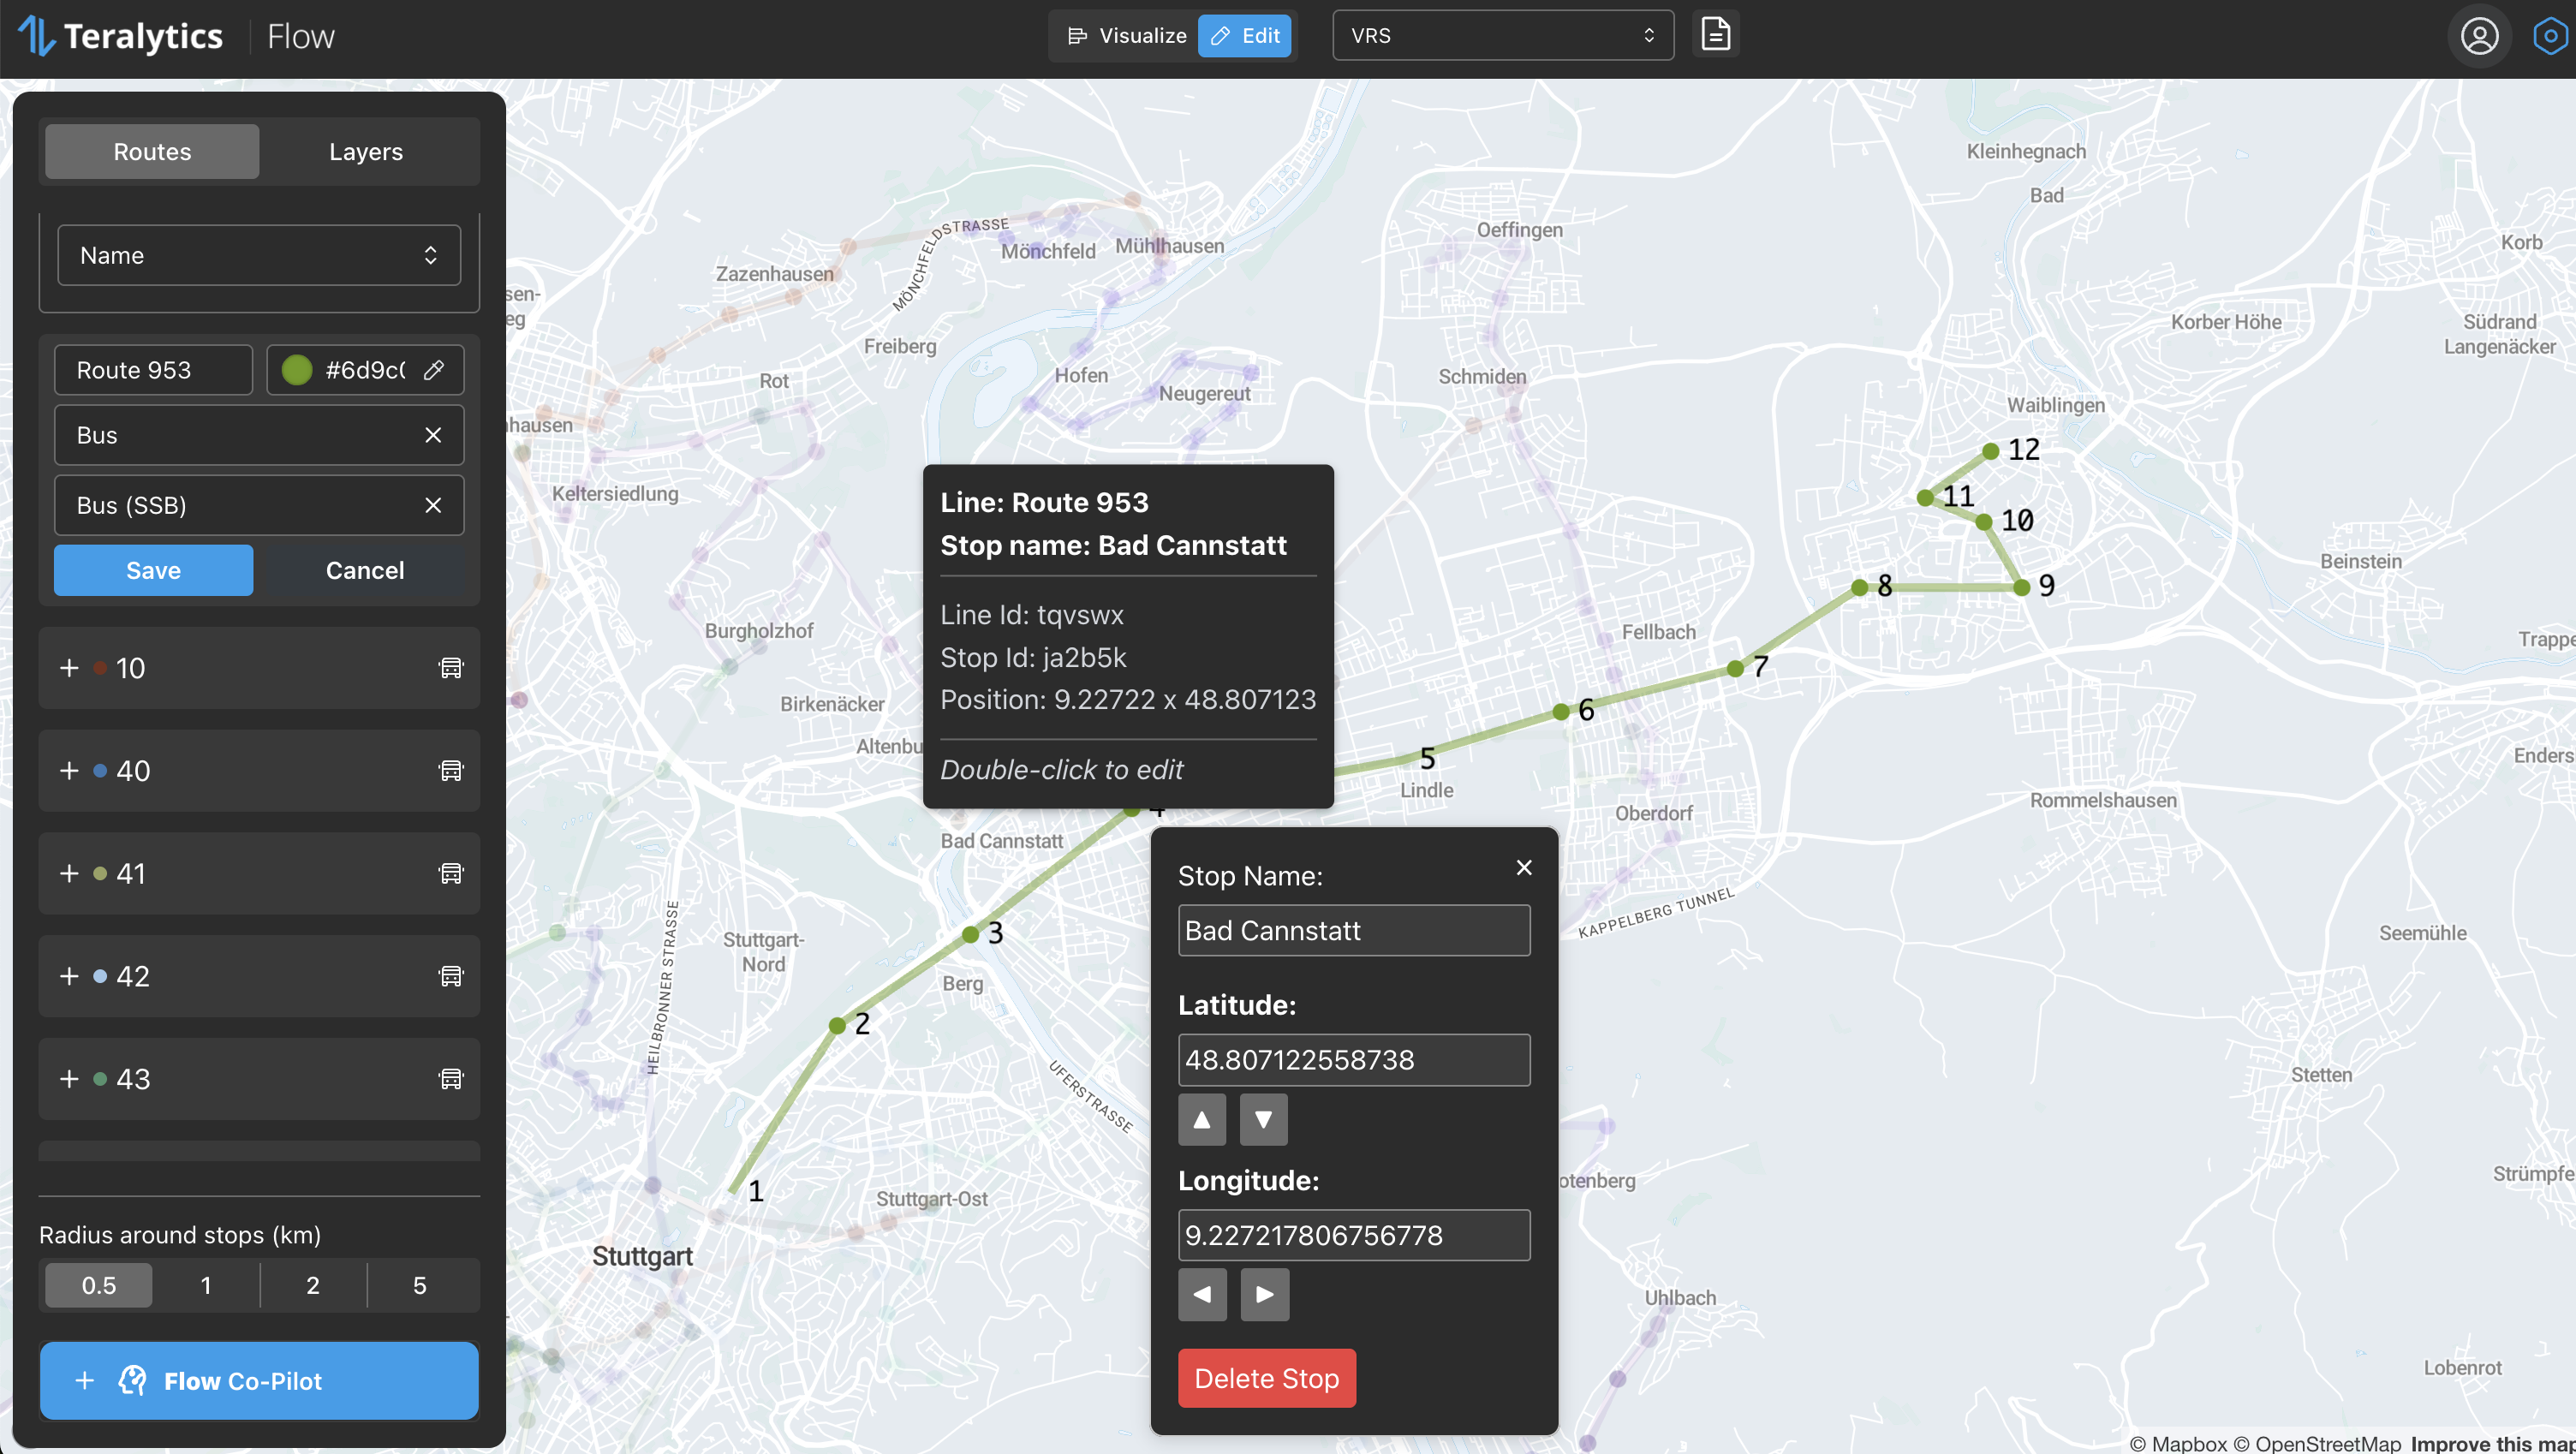
With full GTFS editor

Teralytics Flow offers a fully-fledged editor for network and timetables. This makes it easy to implement changes to the routing or timetables. Customized timetables can also be exported in GTFS format.

Weigh travel times with demand to measure market coverage

Flow then allows you to calculate the change in travel time for a supply scenario. Since the total number of trips between each zone is available in Flow, it is then possible to determine how many trips reach their destination how much faster with the modified public transport service.

Flow transit line editing

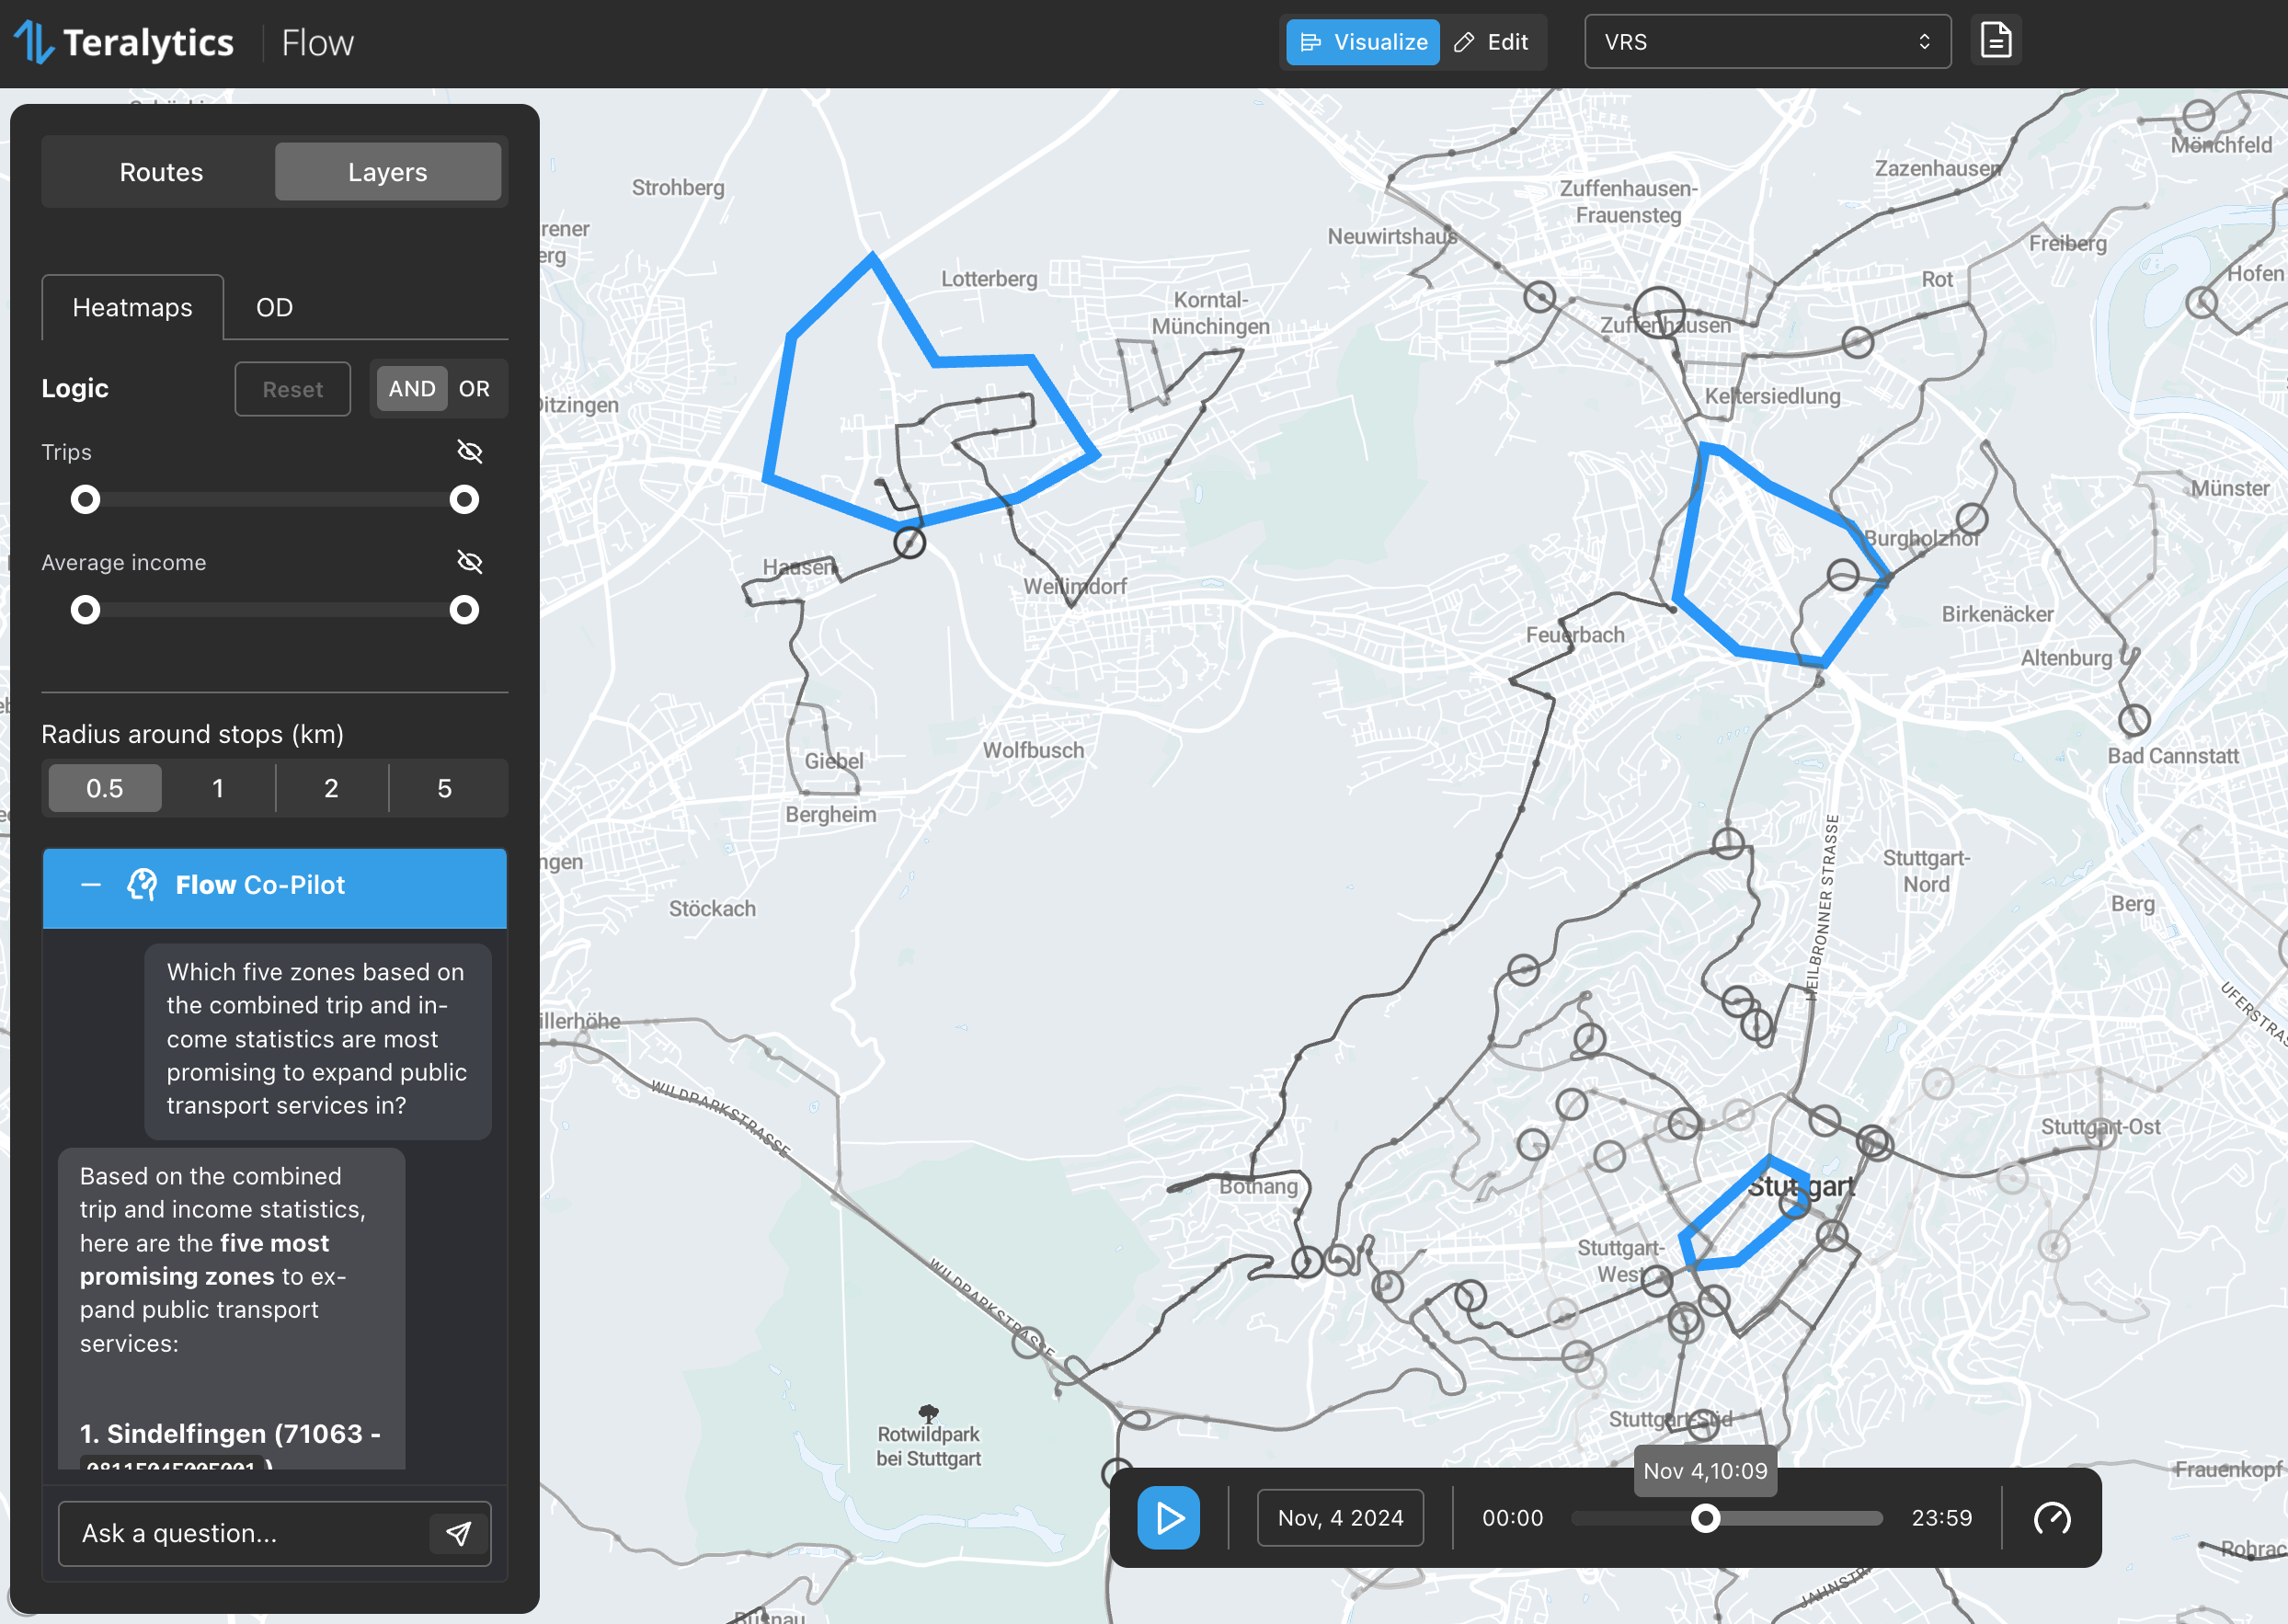
AI Co-Pilot for public transport planners

An AI co-pilot provides support in Flow when dealing with complex planning issues. For example, in the image below, the Flow AI provides information for prioritizing public transport expansion based on the combination of demand and income data.

Flow AI Co-Pilot

Learn more

Do you want to learn more? Book a meeting via this link.

Is the Information Revolution the Catalyst We Need to Improve Cities?

Is the Information Revolution the Catalyst We Need to Improve Cities?

Technology is deeply ingrained in our lives, yet we’re only at the beginning of the information revolution. With data science pushing new frontiers, we’re beginning to unlock the vast potential of data to improve how we understand the world around us.

The latest challenge has been that data is growing faster than our ability to process it. This mountain of data continues to multiply with no end in sight. While we have more information than ever before, it is worthless without the ability to analyze it and extract insights.

We’ve reached a crucial tipping point. The basic tenets and techniques of data science used today have been known for years, but with cloud computing creating a centralized and efficient computing resource, we now have the power to extract qualitative value from the quantity of data.


Smart City Vision: Using New Data to Reorganize Societies

With cities growing worldwide, planners and policy makers need all the help possible to make better decisions on everything from managing traffic to where to develop new infrastructure and housing.

For example, if city planners know that rush hour traffic is worse along certain routes, they can make changes to the road network or reprogramme the traffic light timings. They can add new public transport routes, such as bus lanes or tram stops, and ensure that new housing developments are in areas that don’t compound the problem.

Although cities have been using data for decades, advances in technology have only allowed analytics to take off in the past few years. We now can access new, untapped data sources, such as mobile signal networks that are only possible due to the massive increase in smartphone use in recent years.

Using this data, we’re able to track how human behavior impacts cities and uncover trends to help policymakers make more informed decisions. Decisions could range from the best location to build a bus stop and ease congestion to identifying the part of the city which will benefit from new housing the most.

By organizing society in a new, data-oriented way we can better understand how cities function. This is key to make our cities smarter and creates a continuous feedback loop, allowing us to use this same signal data to determine if a specific change is effective.


Looking Ahead: Where Will Data Science Take Us In The Next Few Years?

The opportunities are endless. However, organizations need to be wary of blindly following the “data religion.” We tend to implicitly trust algorithms and the resulting data, forgetting that the information may be flawed for some reason. Though debugging data is a huge challenge, companies that rely on biased data place themselves in danger of making wrong decisions based on flawed insights.

Cities today are merely scratching the surface in using big data to improve operations. Unlocking powerful mobility data is just one way in which big data can help us improve the way we understand the world around us to create a better quality of life in communities. In healthcare, for example, great strides are being made in using big data to pool experience and intelligence to fight diseases and improve patient outcomes while lowering costs.

We’re at a critical junction right now. The ‘information revolution’ has matured at a much faster rate than the industrial revolution, and the next ten years will change the world more profoundly than the last twenty years. This can be a scary thought, but it’s also an optimistic one, since we have the opportunity to use big data to change the world for the better. The question is can we take advantage of the opportunity and make this vision a reality?

Donald Kossmann is the director of the Microsoft Research Lab in Redmond and co-founder of Teralytics. He is also a professor of computer science at the Institute for Information Systems of ETH Zurich, one of the world’s top universities, a position he’s occupied since 2004.